What Do Chromatograms Tell Us?
What Is a Chromatogram?
A chromatogram is a graphical representation of the separation of components in a mixture based on their chemical properties. This term is commonly used in the context of chromatography, a technique used to separate and analyze complex mixtures. The chromatogram displays data collected during the chromatographic process, typically showing how a particular substance in the mixture interacts with a stationary phase (such as a solid or liquid) and a mobile phase (usually a gas or liquid). The result is a graph with a time axis (x-axis) and a response signal (y-axis) where peaks represent different compounds.
In chromatography, compounds are separated based on their different affinities for the stationary and mobile phases. As a sample passes through the system, each compound interacts differently with the stationary phase, causing some to move faster and others slower, depending on their properties such as polarity, size, and charge. The chromatogram records these interactions and shows how long each compound takes to elute, known as the retention time.
There are several types of chromatography that produce chromatograms, including gas chromatography (GC), high-performance liquid chromatography (HPLC), and thin-layer chromatography (TLC). Each type of chromatography utilizes different methodologies for separating substances, but the resulting chromatogram serves as a universal tool for analysis. For example, in GC, the mobile phase is a gas, while in HPLC, it is a liquid. These variations influence the shape and resolution of the chromatogram, which in turn affects data interpretation.
The chromatogram is essential in scientific research, chemical analysis, and quality control in industries ranging from pharmaceuticals to environmental testing. The peaks in a chromatogram can help identify compounds, determine concentrations, and assess purity. The area under each peak is directly proportional to the amount of the compound present, making the chromatogram a quantitative as well as qualitative tool.
How to Read a Chromatogram?
Interpreting a chromatogram requires an understanding of its axes, peaks, and other key parameters. The x-axis of the chromatogram typically represents time (retention time), which indicates how long it takes for a compound to travel through the column and be detected. The y-axis represents the detector response, such as absorbance or signal intensity, which correlates to the concentration of a compound as it exits the chromatographic column.
Retention Time: Each compound in the mixture has a characteristic retention time, which is the time it takes to elute from the chromatographic column and be detected. By comparing the retention time of an unknown compound to that of known standards, one can identify the compound. The retention time is influenced by the column temperature, mobile phase composition, flow rate, and the specific interactions between the compound and the stationary phase.
Peak Shape: In a well-resolved chromatogram, each compound appears as a distinct peak. The ideal peak shape is symmetric, resembling a Gaussian distribution. Asymmetry in peaks, such as tailing or fronting, may indicate problems with the chromatographic system, such as column overloading, poor sample preparation, or interaction issues between the compound and the stationary phase.
Peak Height and Area: The height of a peak correlates to the concentration of the compound being analyzed. However, for more accurate quantification, the area under the peak is used. The area is proportional to the amount of compound that has been detected. By comparing the peak areas of unknown samples to calibration curves of known standards, one can determine the concentration of the compounds.
Dead Time: The dead time is also known as void time or holdup time. The dead time is the minimum time required, after injection, for a compound to pass through the column and be analyzed.
Resolution: The degree to which two adjacent peaks are separated is known as resolution. Proper resolution ensures that individual compounds are clearly distinguishable. If two compounds have similar retention times but do not separate well on the chromatogram, their peaks may overlap, making it difficult to identify and quantify each one. The resolution can be improved by adjusting the column length, temperature, flow rate, or mobile phase composition.
Baselines and Noise: The baseline of a chromatogram is the detector response when no compounds are eluting. A stable baseline is crucial for accurate data analysis. However, noise can sometimes appear due to system fluctuations, detector sensitivity, or contaminants. Elevated or unstable baselines may interfere with peak detection, reducing the reliability of the chromatogram.
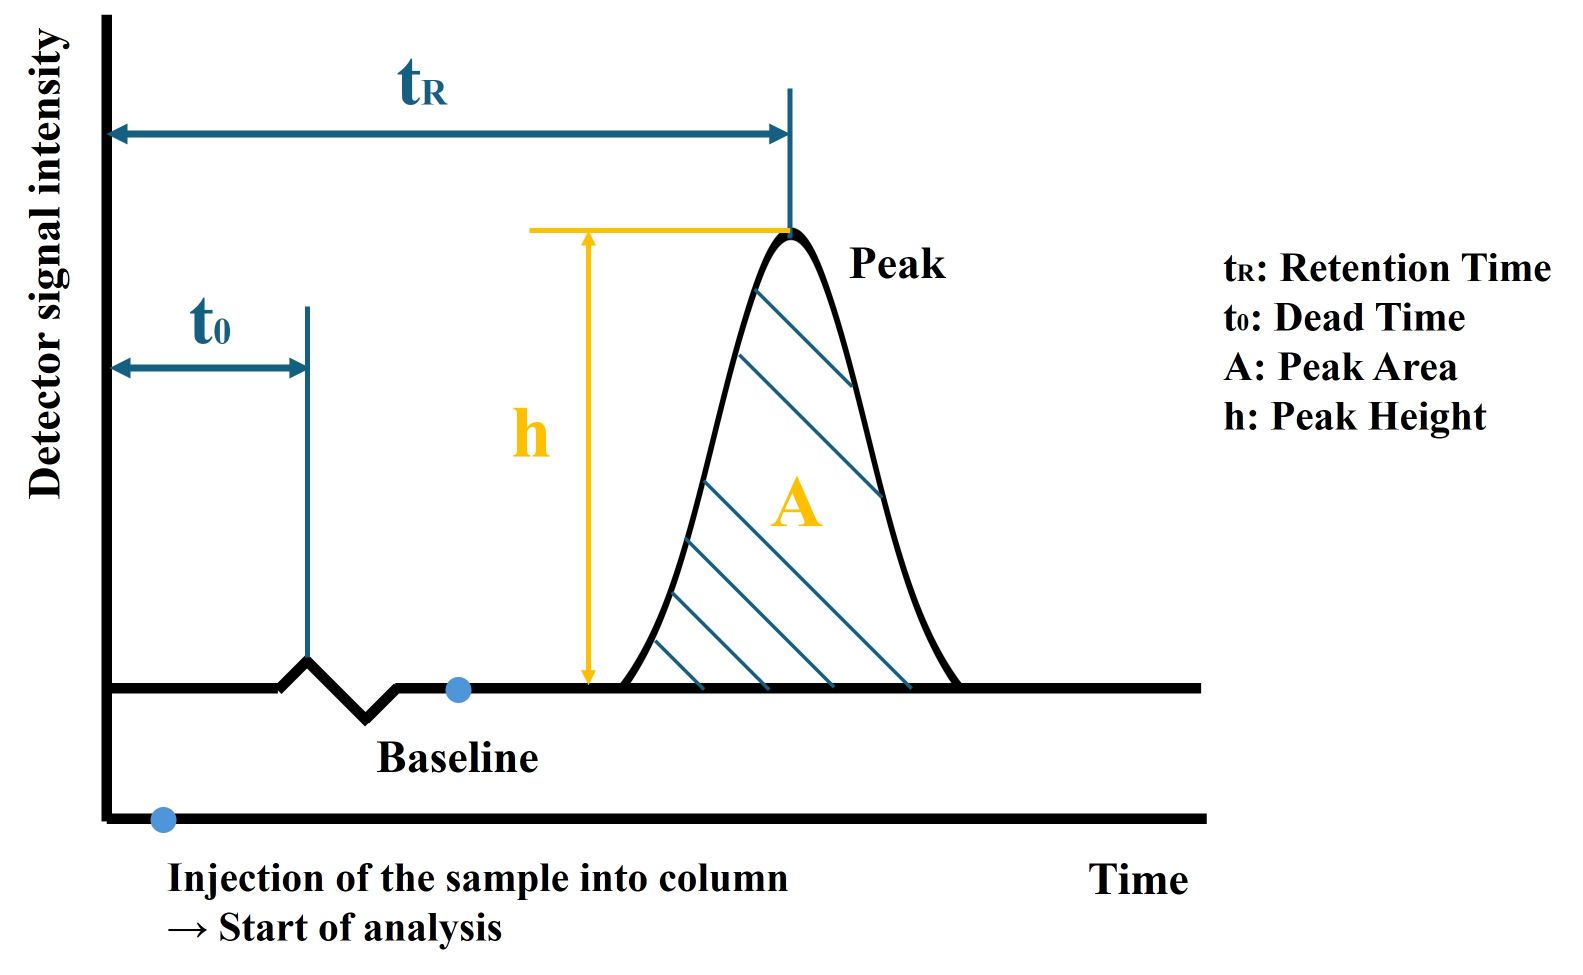 Figure 1. A simplified chromatogram.
Examples of Chromatogram
Gas Chromatogram
Gas chromatography (GC) is commonly used for analyzing volatile compounds. In GC, the sample is vaporized and injected into a carrier gas (the mobile phase), which transports the sample through a column packed with a stationary phase. A GC chromatogram typically shows several peaks representing different components of a volatile mixture, such as hydrocarbons in petroleum or pollutants in air samples. Each peak corresponds to a compound's retention time, and by comparing these times to known standards, the compounds can be identified.
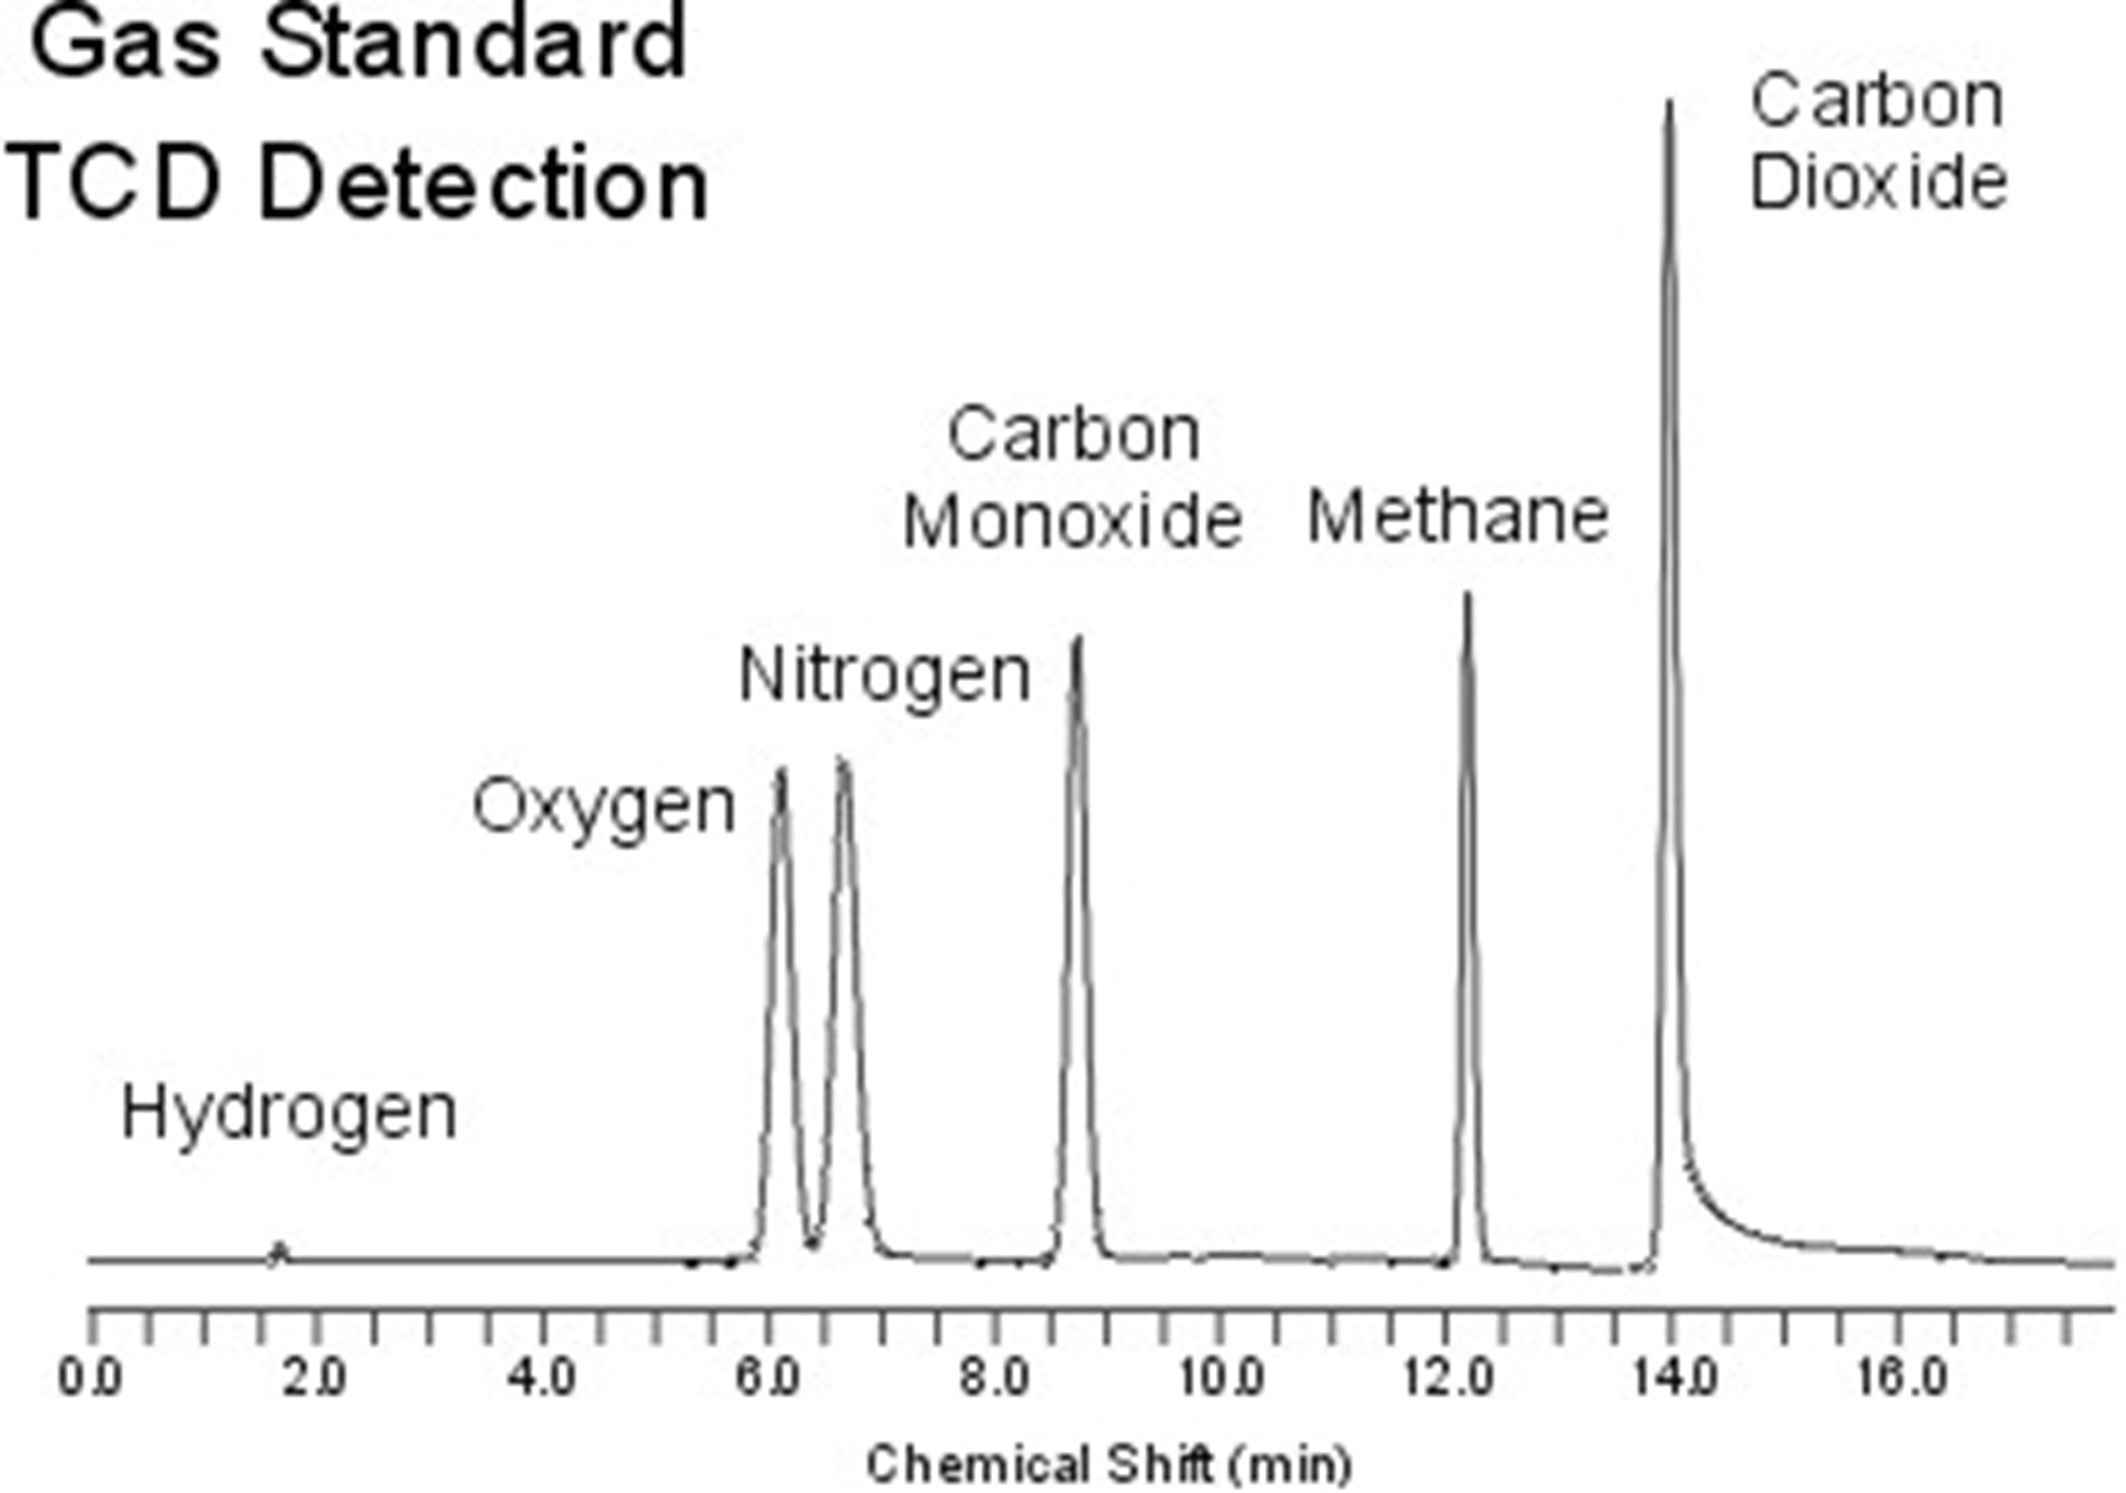 Figure 2. Standard chromatogram of a mixture of gases (Chemistry LibreTexts).
In structural biology, a GC chromatogram might be used to analyze volatile compounds produced during protein-ligand interactions. For example, gas chromatography can be employed to study the release of volatile organic compounds (VOCs) during enzymatic reactions in protein structures. A GC chromatogram may show distinct peaks corresponding to the specific VOCs released as by-products of the reaction, with retention times and peak areas providing insights into the enzymatic activity and efficiency. This data can be used to better understand the catalytic mechanisms of enzymes, contributing to the design of inhibitors or drugs that target specific protein-ligand interactions in therapeutic research.
HPLC Chromatogram
High-performance liquid chromatography (HPLC) is used to analyze compounds that are not volatile enough for GC. In HPLC, the mobile phase is a liquid, and it passes through a column containing a stationary phase. HPLC is widely used in pharmaceutical analysis, where it ensures the quality and purity of drugs. The resulting chromatogram displays peaks for each compound in the sample, with retention times helping in their identification.
In pharmaceutical analysis, an HPLC chromatogram might show the separation of active ingredients from impurities in a drug sample. The sharpness of the peaks and the resolution between them allow for precise identification and quantification, which is critical for ensuring drug safety and efficacy. Peaks representing impurities can be compared to regulatory thresholds to determine if the drug meets quality standards.
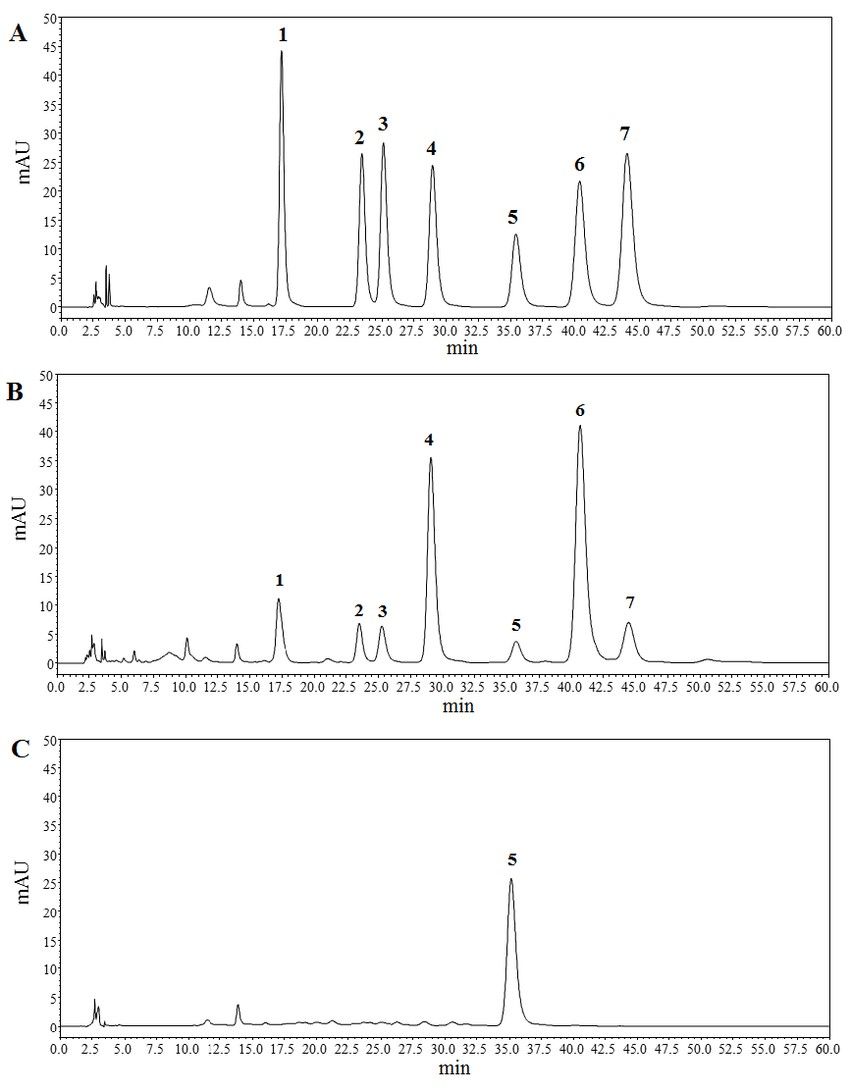 Figure 3. High performance liquid chromatography (HPLC) chromatograms of hydrolyzed polysaccharide derivatives. (A) is HPLC chromatogram of monosaccharide standards. (B) and (C) are HPLC chromatograms of acidic fraction of total polysaccharides-II (TPA-II) and neutral fraction of total polysaccharides-II (TPN-II), respectively. (1) mannose (Man), (2) rhamnose (Rha), (3) glucuronic acid (GluA), (4) galacturonic acid (GalA), (5) glucose (Glu), (6) galactose (Gal), (7) arabinose (Ara) (Hu et al., 2019).
Size-Exclusion Chromatography
In biological sciences, size-exclusion chromatography (SEC) is used to separate proteins based on their size. The resulting chromatogram often shows peaks corresponding to different molecular weights of proteins. Larger molecules elute earlier because they pass through the column without being trapped in the pores of the stationary phase, while smaller molecules elute later.
For example, SEC can be used in the purification of antibodies, with the chromatogram showing distinct peaks for the monomeric form of the antibody versus potential aggregates. The resolution of these peaks helps in determining the purity of the sample and ensuring that it meets therapeutic standards.
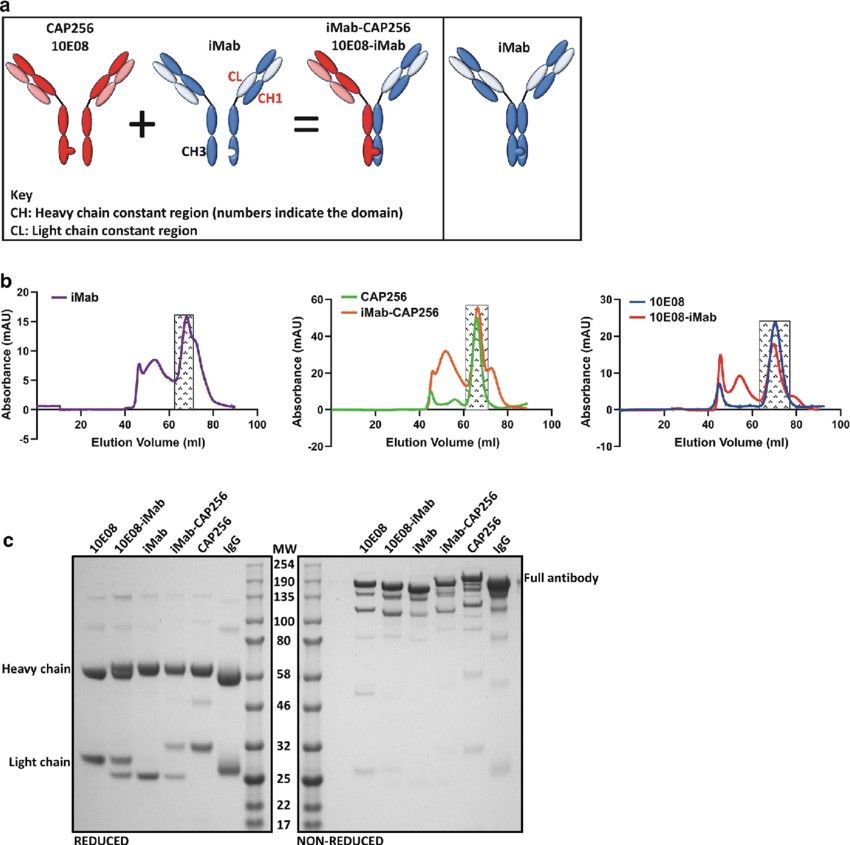 Figure 4. Bispecific antibody design, purification and SDS-PAGE analysis. a Left panel: Schematic of the iMab-CAP256 or 10E08-iMab bibNAb, with 'knob' mutations introduced into the CH3 region of CAP256 or 10E08 and complementing 'hole' mutations introduced into the CH3 region of iMab. Additionally, the CH1 region and the CL region of iMab were interchanged to create a bibNAb with a Crossmab CH1-CL configuration. a Right panel: Schematic of iMab engineering using knob-in-a-hole and CrossMab CH1-CL to serve as a suitable assembly control. b Size exclusion chromatograms of Protein-A purified antibodies. Shaded rectangles represent collected and pooled fractions corresponding to the monomeric antibody conformation. c SDS-PAGE analysis of antibodies under reducing and non-reducing conditions posts size exclusion chromatography. Purified human IgG was included as a positive control (Moshoette et al., 2019).
In conclusion, chromatograms serve as vital tools for the analysis of chemical mixtures, providing both qualitative and quantitative data. By understanding the structure and interpretation of chromatograms—ranging from gas and liquid chromatography to size-exclusion—scientists can accurately identify and quantify compounds. Each type of chromatogram has its specific use cases, and its interpretation plays a crucial role in fields as diverse as environmental science, pharmaceuticals, and biotechnology.
At Creative Biostructure, we specialize in offering a comprehensive range of chromatographic analyses tailored for structural biology research. From affinity chromatography to ion exchange and gel filtration chromatography, our advanced techniques ensure precise separation and analysis of biomolecules, providing critical insights into their structure and function. Whether you're looking to purify proteins, analyze molecular interactions, or study complex biological systems, our state-of-the-art technology and expert team are here to support your research needs. Contact us today to learn more about how our chromatographic services can accelerate your discoveries. Let's push the boundaries of structural biology together.
References
- Hu, M., Liu, Y., Wang, L., Wang, J., Li, L., & Wu, C. (2019). Purification, characterization of two polysaccharides from pinelliae rhizoma praeparatum cum alumine and their anti-inflammatory effects on mucus secretion of airway epithelium. International Journal of Molecular Sciences, 20(14), 3553.
- Lathe, G. H., & Ruthven, C. R. J. (1956). The separation of substances and estimation of their relative molecular sizes by the use of columns of starch in water. Biochemical Journal, 62(4), 665–674.
- Moshoette, T., Ali, S. A., Papathanasopoulos, M. A., & Killick, M. A. (2019). Engineering and characterising a novel, highly potent bispecific antibody iMab-CAP256 that targets HIV-1. Retrovirology, 16(1), 31.


