Nuclear Magnetic Resonance (NMR) spectroscopy is a fundamental analytical technique in chemistry and structural biology, used to determine molecular structures and interactions. While one-dimensional (1D) NMR provides valuable information, its limitations in resolving complex spectral data have led to the development of two-dimensional (2D) NMR spectroscopy. This technique enhances spectral resolution by spreading signals over two frequency dimensions, allowing for better identification of correlations between nuclei.
In this article, Creative Biostructure introduces the fundamental principles of 2D NMR spectroscopy, types of 2D NMR experiments, how to read and interpret their spectra, and their applications in structural biology. We offer advanced and professional NMR spectroscopy services ranging from the production of labeled proteins to the acquisition and analysis of high-field NMR data for researchers in academia and the pharmaceutical industry.

Fundamentals of 2D NMR Spectroscopy
Principles of NMR Spectroscopy
NMR spectroscopy relies on the interaction of nuclear spins with an external magnetic field. When placed in such a field, certain nuclei (e.g., 1H, 13C, 15N, and 31P) absorb radiofrequency radiation at specific resonant frequencies, depending on their chemical environment. These signals can be analyzed using techniques like Fourier transform and chemical shift calibration, providing insight into molecular structure, connectivity, and dynamics.
 Figure 1. Schematic diagram of NMR principle. (Cao et al., 2020)
Traditional 1D NMR spectra plot signal intensity against a single frequency axis, which is useful for simple molecules but becomes crowded and difficult to interpret for complex structures. 2D NMR overcomes these challenges by spreading the interactions across two frequency dimensions.
Types of 2D NMR Experiments
Two-dimensional NMR (2D NMR) techniques enhance structural analysis by correlating different nuclear interactions, providing insight into molecular connectivity, spatial proximity, and dynamic behavior. These experiments are broadly categorized into homonuclear and heteronuclear correlation techniques, each serving a specific purpose in structural elucidation.
Correlation Spectroscopy (COSY) – Mapping Scalar Couplings
Purpose
COSY (Correlation Spectroscopy) is a fundamental homonuclear 2D NMR technique used to identify scalar (J-coupled) interactions between protons within a molecule. It is especially useful for determining connectivity in organic compounds and small biomolecules.
How It Works?
- A COSY spectrum consists of a diagonal line, where each peak corresponds to a chemical shift observed in a 1D 1H spectrum.
- Cross-peaks appear off the diagonal, indicating scalar couplings between protons separated by three or fewer bonds (typically through bonds such as C–C or C–O).
- By tracing these cross-peaks, researchers can determine how protons are connected within a molecular framework.
A Simple Example: COSY Spectrum of 2-Butanone (C₄H₈O)
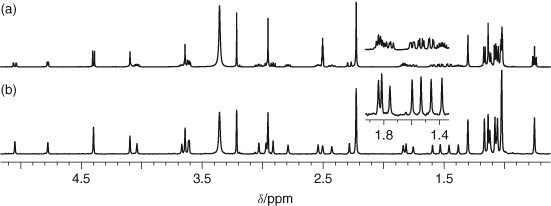
In the COSY spectrum of 2-butanone, diagonal peaks correspond to the 1D 1H NMR signals, while cross peaks indicate scalar (J-coupled) interactions between pairs of protons. To analyze the COSY spectrum, the first step is to draw the diagonal line, which represents the proton chemical shifts from the 1D spectrum. Next, cross peaks, or correlations, should be identified, as each one signifies a coupling between two protons. In 2-butanone, key interactions include the methyl group (CH3) at δ ~1.0 ppm coupling with the methylene group (CH2) at δ ~2.4 ppm, and the methine proton (CH) at δ ~2.2 ppm coupling with the same methylene group (CH2) at δ ~2.4 ppm. Once the correlations are identified, lines should be drawn to connect the diagonal peaks to their corresponding cross peaks, revealing the spin-spin interactions. Finally, these correlations should be marked on the molecular structure using double-headed arrows to indicate the couplings between CH3 and CH2, as well as CH and CH2.
 Figure 2. A: 1D 1H NMR spectrum of 2-butanone (C4H8O). B and C: COSY spectrum for 2-butanone. D. Molecular structure of 2-butanone with double-headed arrows to illustrate these couplings.
Applications
- Assigning proton-proton connectivities in organic molecules, peptides, and nucleotides.
- Verifying molecular backbones in synthetic chemistry.
- Identifying spin systems in complex natural products.
Case Study: Dufour et al., 2015
This study demonstrates the use of 2D correlation spectroscopy (COSY) NMR for the quantification of 2-hydroxypropyl-β-cyclodextrin in plasma. Unlike traditional analytical methods that require time-consuming sample pretreatment and extraction, NMR analysis provides a more efficient and accurate quantification process without the need for extensive sample handling. While quantitative NMR (qNMR) could not be applied to 2D spectra, the study showed that cross-correlations and diagonal peak intensities correlated linearly with the concentration of the drug compound. Validation criteria, including specificity, linearity, precision, accuracy, and limits of quantification, confirmed the reliability of this method. The study suggests that 2D-NMR is a valuable and accurate tool for the quantification of pharmaceutical compounds, including difficult-to-detect substances such as cyclodextrins, in complex biological matrices using a calibration curve approach.
 Figure 3. 2D-COSY NMR spectra of 2-hydroxypropyl-β-cyclodextrin in plasma at a concentration of 0.112 mM (left). The correlation spot between the methyl of the hydroxypropyl group (1.1 ppm) and the proton H3 of the cyclodextrin central cavity (4 ppm) is enlarged. Blank plasma spectrum focuses on 1.1/4 ppm area (right). A square highlight the absence of interference in this spectral zone. (Dufour et al., 2015)
Total Correlation Spectroscopy (TOCSY) – Extending Connectivity Analysis
Purpose
TOCSY (Total Correlation Spectroscopy) extends COSY by linking all protons within a given spin system, even if they are more than three bonds apart. This allows the identification of entire proton networks in a molecule.
How It Works?
- Like COSY, TOCSY generates a diagonal and cross-peaks, but with additional long-range correlations spanning entire spin systems.
- The technique uses isotropic mixing, which transfers magnetization throughout a system of coupled protons.
Applications
- Assigning complete proton spin systems in peptides, sugars, and other biopolymers.
- Differentiating overlapping spin systems in complex mixtures.
- Identifying the connectivity of polysaccharides and carbohydrates.
A Simple Example: Amino Acids Spectrum
In amino acids, TOCSY can link all protons of a given residue, distinguishing them from neighboring residues in peptide sequences.
 Figure 4. Typical TOCSY values for amino acids.
Case Study: Hamway et al., 2022
Parasites use various strategies to communicate with their hosts, one of which is the use of vesicle microRNAs to modulate the host immune system. Recent studies have shown that sma-microRNA-10, secreted by Schistosoma mansoni, can influence host T-cell behavior by manipulating the NF-κB pathway. In this study, the researchers identified small molecules capable of interfering with this microRNA-mediated immune modulation. Using a fragment-based screening approach with nuclear magnetic resonance (NMR), they identified small molecules that bind to the precursor of the parasite's sma-microRNA-10, which is found in extracellular vesicles. These small fragments were then used to select larger compounds that were shown to counteract the inhibition of NF-κB activity caused by sma-microRNA-10 in cell-based assays.
 Figure 5. 2D total correlation spectroscopy (TOCSY) NMR fingerprints of the RNA oligonucleotide containing the target binding site of sma-premiR-10. (Hamway et al., 2022)
Nuclear Overhauser Effect Spectroscopy (NOESY) – Probing Spatial Proximity
Purpose
NOESY (Nuclear Overhauser Effect Spectroscopy) is a homonuclear 2D NMR experiment designed to detect through-space interactions between protons that are spatially close (within ~5 Å), regardless of their covalent connectivity. This makes NOESY crucial for determining 3D molecular structures.
How It Works?
- Cross-peaks in NOESY spectra arise due to dipole-dipole interactions between protons in close proximity.
- The intensity of NOE cross-peaks is inversely related to the sixth power of the interproton distance, making NOESY highly sensitive to spatial arrangement.
Applications
- Determining the 3D conformation of proteins, nucleic acids, and organic molecules.
- Differentiating between cis- and trans-conformations in cyclic systems.
- Identifying bound and free states of ligands in drug-target studies.
Case Study: Mishra et al., 2017
This study demonstrated that 2D NOESY NMR is an effective tool for determining the stereochemistry and conformational rigidity of iminoboronate ester. The findings confirmed its E-geometry and single conformer state, providing valuable insights for further applications in chemical and pharmaceutical research.
 Figure 6. The 400 MHz 1H 2D NOESY spectrum of iminoboronate ester prepared for chiral primary amine labeled 1 in S-mandelic acid. (Mishra et al., 2017)
Heteronuclear Single Quantum Coherence (HSQC) – Detecting One-Bond Couplings
Purpose
HSQC (Heteronuclear Single Quantum Coherence) is a heteronuclear 2D NMR technique that correlates proton (1H) chemical shifts with directly bonded heteronuclei (13C, 15N, etc.). This technique is particularly useful in protein NMR and complex organic molecules.
How It Works?
- Each cross-peak in an HSQC spectrum represents a direct bond between a proton and a heteronucleus.
- The 1H shifts appear along one axis, and the corresponding heteronuclear (13C or 15N) shifts appear along the other.
Applications
- Assigning 1H-13C or 1H-15N pairs in proteins, DNA, and complex organic molecules.
- Analyzing isotopically labeled biomolecules.
- Detecting structural changes in biomolecules upon ligand binding.
Case Study: Wu et al., 2010
NleG homologues form the largest family of type 3 effectors in pathogenic E. coli, with 14 members in the EHEC O157:H7 strain. Despite being part of the non-LEE-encoded (Nle) effector set, these proteins were previously uncharacterized and lacked sequence homology to known functional proteins.
NMR and mutagenesis studies confirmed that the UBE2D2 interaction interface on NleG2-3 closely resembles that of human RING finger ubiquitin ligases. Substituting critical UBE2D2 residues (Arg5 and Lys63) significantly reduced NleG binding and autoubiquitination activity. These findings establish NleG effectors as bacterial E3 ubiquitin ligases functionally analogous to eukaryotic RING finger and U-box enzymes.
 Figure 7. 1H–15N HSQC spectrum of a fragment of the protein NleG3-2. Each peak in the spectrum represents a bonded N–H pair, with its two coordinates corresponding to the chemical shifts of each of the H and N atoms. Some of the peaks are labeled with the amino acid residue that gives that signal. (Wu et al., 2010)
Heteronuclear Multiple Bond Correlation (HMBC) – Revealing Long-Range Couplings
Purpose
HMBC (Heteronuclear Multiple Bond Correlation) provides information on long-range (multiple-bond couplings 2J and 3J) proton- heteronuclear couplings, typically over two to four bonds. This technique is valuable for determining connectivity in complex molecules.
How It Works?
- Unlike HSQC, which detects only one-bond couplings, HMBC captures multiple-bond couplings, helping to connect distant nuclei within a molecular framework.
- Cross-peaks reveal relationships between protons and carbon or nitrogen atoms that are two to four bonds apart.
Applications
- Establishing connectivity in natural products and small molecules.
- Determining complete molecular skeletons in complex organic compounds.
- Assigning quaternary carbons in 13C spectra.
- Particularly useful in elucidating the structure of alkaloids, where it helps identify the placement of non-protonated carbons within the molecular backbone.
Case Study: Canudo-Barreras et al., 2022
This study presents the first reported example of a gold-catalyzed approach to the synthesis of 1,3-thiazine and 1,3-thiazinane derivatives. The methodology provides a catalytic route to efficiently access these compounds, overcoming challenges in tautomer isolation and characterization. The researchers use HMBC NMR to determine the coupling between the NH and the aromatic C bearing the resulting tautomer.
 Figure 8. HMBC NMR (300 MHz, 75 MHz, CD3COCD3) spectrum for 1,3-Thiazine. (Canudo-Barreras et al., 2022)
Comparison of 2D NMR Techniques
| Technique | Type | Key Interactions | Primary Application |
|---|---|---|---|
| COSY | Homonuclear | 1H-1H (scalar couplings) | Connectivity between neighboring protons |
| TOCSY | Homonuclear | 1H-1H (long-range within a spin system) | Identifying complete proton networks |
| NOESY | Homonuclear | 1H-1H (through-space interactions) | Determining 3D molecular structure |
| HSQC | Heteronuclear | 1H-13C or 1H -15N (one-bond couplings) | Assigning heteronuclear correlations |
| HMBC | Heteronuclear | 1H-13C or 1H -15N (two- to four-bond couplings) | Determining molecular connectivity |
How to Read and Interpret 2D NMR Spectra?
2D NMR spectra are typically displayed as contour plots, with two frequency axes (e.g., 1H–1H or 1H–13C). The key elements to consider when interpreting these spectra are:
Step 1: Diagonal and Cross-Peaks
In COSY and NOESY spectra, the diagonal peaks represent conventional 1D NMR peaks. Cross-peaks (off-diagonal peaks) indicate interactions between different nuclei, providing connectivity information. The position and intensity of these cross-peaks determine how atoms in a molecule are linked.
 Figure 9. 1H COSY spectrum of progesterone. The spectrum that appears along both the horizontal and vertical axes is a regular one dimensional 1H NMR spectrum. The bulk of the peaks appear along the diagonal, while cross-peaks appear symmetrically above and below the diagonal.
Step 2: Peak Assignments
Peak assignment involves correlating chemical shifts with known structural fragments. For example, in an HSQC spectrum, cross-peaks between 1H and 13C shifts allow assignment of specific carbon-hydrogen pairs in a molecule.
 Figure 10. Typical ranges of isotropic 13C NMR chemical shifts. (Mazur et al., 2020)
Step 3: J-Coupling and Spin Systems
COSY and TOCSY spectra help identify scalar-coupled networks of protons. By analyzing J-coupling patterns, chemists can deduce how protons are connected through chemical bonds.
 Figure 11. A. Energy diagram showing the effects of J-coupling for the molecule hydrogen fluoride. B. Example 1H NMR spectrum (1-dimensional) of ethanol plotted as signal intensity vs. chemical shift. There are three different types of H atoms in ethanol regarding NMR. The hydrogen (H) on the −OH group is not coupling with the other H atoms and appears as a singlet, but the CH3− and the −CH2− hydrogens are coupling with each other, resulting in a triplet and quartet respectively.
Step 4: NOESY for Spatial Relationships
NOESY spectra provide through-space correlations that are critical for determining 3D molecular structures. A strong NOE cross-peak between two protons indicates their spatial proximity (<5 Å), which is particularly valuable in biomolecular studies.
 Figure 12. Right: Spatial correlations observed from NOESY spectra of 1 and 2. (Aguilar-Guadarrama and Rios, 2004)
Step 5: Heteronuclear Correlation for Full Structure Elucidation
HSQC and HMBC experiments are essential for identifying heteronuclear connectivity, helping determine molecular backbones and distinguishing between similar functional groups.
 Figure 13. 2D homo- and heteronuclear spectroscopy of lyotropic lipidic cubic phases: (a) The chemical structure of MO with carbon atoms numbered, (b) partial 1H–1H DQF-COSY, and (c) multiplicity edited 1H–13C HSQC (CH and CH3 in black and CH2 in red) of LCPs formed by MO at a hydration of 35 wt%. Both spectra were acquired on a Bruker Avance III 600 spectrometer equipped with a TCI cryoprobe at 298 K. (Yao et al., 2023)
Applications of 2D NMR in Structural Biology
- Protein Structure Determination: 2D NMR is extensively used in protein structure determination, particularly for small- to medium-sized proteins (<30 kDa). Techniques such as 1H-15N HSQC provide "fingerprints" of protein folding and ligand binding.
- Investigating Protein-Ligand Interactions: 2D NMR is crucial for studying protein-ligand interactions. Changes in cross-peak positions (chemical shift perturbations) or peak intensities in NOESY or HSQC spectra indicate binding events, helping map interaction sites.
- Dynamics and Conformational Studies: NMR captures protein dynamics by analyzing exchange rates and relaxation properties, offering insights into conformational flexibility.
At Creative Biostructure, our state-of-the-art NMR services deliver accurate structural insights for pharmaceuticals, biomolecules, and complex mixtures—without the need for extensive sample preparation. Whether you need quantitative NMR (qNMR), 2D-NMR, or custom analytical solutions, we provide fast, reliable, and publication-ready results to accelerate your research and development. Contact us today to discuss your project!
References
- Aguilar-Guadarrama AB, Rios MY. Three New Sesquiterpenes from Croton arboreous. J Nat Prod. 2004;67(5):914-917. doi:10.1021/np030485f
- Canudo-Barreras G, Salvador D, Herrera RP, Gimeno MC. Gold-catalyzed 1,3-thiazine formation and uncommon tautomer isolation. J Org Chem. 2022;87(16):10747-10754. doi:10.1021/acs.joc.2c00947
- Cao R, Liu X, Liu Y, et al. Applications of nuclear magnetic resonance spectroscopy to the evaluation of complex food constituents. Food Chemistry. 2021;342:128258. doi:10.1016/j.foodchem.2020.128258
- Dufour G, Evrard B, de Tullio P. 2D-cosy NMR spectroscopy as a quantitative tool in biological matrix: application to cyclodextrins. AAPS J. 2015;17(6):1501-1510. doi:10.1208/s12248-015-9806-9
- Fattori J, Rodrigues FHS, Pontes JGM, Paula Espíndola A, Tasic L. Chapter 6 - monitoring intermolecular and intramolecular interactions by NMR spectroscopy. In: UR-Rahman A, Choudhary MI, eds. Applications of NMR Spectroscopy: Volume 3. Bentham Science Publishers; 2015:180-266. doi:10.1016/B978-1-68108-063-5.50006-0
- Forse A. Nuclear magnetic resonance studies of ion adsorption in supercapacitor electrodes. Published online August 5, 2015. doi:10.17863/CAM.26359
- Hamway Y, Zimmermann K, Blommers MJJ, et al. Modulation of host–parasite interactions with small molecules targeting Schistosoma mansoni microRNAs. ACS Infect Dis. 2022;8(10):2028-2034. doi:10.1021/acsinfecdis.2c00360
- Mazur AS, Vovk MA, Tolstoy PM. Solid-state 13C NMR of carbon nanostructures (Milled graphite, graphene, carbon nanotubes, nanodiamonds, fullerenes) in 2000–2019: a mini-review. Fullerenes, Nanotubes and Carbon Nanostructures. 2020;28(3):202-213. doi:10.1080/1536383X.2019.1686622
- Mishra SK, Chaudhari SR, Lakshmipriya A, Pal I, Lokesh N, Suryaprakash N. Novel synthetic as well as natural auxiliaries with a blend of NMR methodological developments for chiral analysis in isotropic media. In: Annual Reports on NMR Spectroscopy. Vol 91. Elsevier; 2017:143-292. doi:10.1016/bs.arnmr.2016.12.001
- Wu B, Skarina T, Yee A, et al. NleG type 3 effectors from enterohaemorrhagic Escherichia coli are u-box E3 ubiquitin ligases. Stebbins CE, ed. PLoS Pathog. 2010;6(6):e1000960. doi:10.1371/journal.ppat.1000960
- Yao S, Meikle TG, Separovic F, Keizer DW. Recent studies of lyotropic lipidic cubic phases. In: Annual Reports on NMR Spectroscopy. Vol 110. Elsevier; 2023:31-78. doi:10.1016/bs.arnmr.2023.09.001


